Quick Answer
Commercial PIR detectors commonly describe pet immunity by a maximum pet weight, but during optical development engineers also need a measurable way to compare human and pet signals.
Two useful engineering metrics are threshold margin and human-to-pet signal separation.
- Method A — margin to the detection threshold.
Measure how far the human signal is above the detector threshold and how far the pet signal remains below it. - Method B — human-to-pet signal separation.
Compare the pet signal directly with the human signal, for example using
(human − pet) / human × 100. - The two methods answer different questions.
Threshold margin tells you whether the complete detector is likely to make the correct decision, while signal separation helps evaluate how effectively the optical system distinguishes the two targets. - A good signal ratio does not guarantee human detection.
Both human and pet signals can be low while their percentage difference remains large. - A threshold margin is detector-dependent.
Its result depends on the selected threshold, gain, temperature behavior and signal-processing conditions. - A development specification should therefore define the metric, formula, measurement conditions and required distance range explicitly.
What does a PIR pet immunity specification actually mean?
Pet immunity is the ability of a passive infrared (PIR) motion detector to detect a person while reducing unwanted alarms caused by animals such as cats and dogs.
Commercial products frequently describe this capability using a maximum pet weight, such as a detector intended for pets up to a specified number of kilograms.
During lens and detector development, however, weight alone does not tell an optical engineer how the PIR signals should behave.
The development team normally needs measurable signal criteria that can be evaluated at different positions in the detection area.
Two useful engineering approaches are:
- measuring the human and pet signals relative to the detector’s decision threshold; and
- measuring the separation between the human and pet signals themselves.
These are not two universal industry definitions of pet immunity.
They are two different engineering metrics that can be used when developing and evaluating a pet-immune PIR optical system.
A practical PIR detector ultimately needs two conditions to be satisfied:
- The human signal must be sufficiently detectable under the detector’s decision logic.
- The pet signal must remain sufficiently separated from the alarm condition under the intended operating conditions.
The difficulty is that the lens designer, sensor designer and firmware engineer may evaluate those conditions using different reference points.
Unless the development requirement defines the measurement method explicitly, two teams can calculate very different percentages from the same signal data.
How does Method A measure margin to the detection threshold?
Method A uses the detector’s decision threshold as the reference and evaluates two margins separately.
- Human headroom — the amount by which the human signal exceeds the selected threshold.
- Pet margin — the amount by which the pet signal remains below the selected threshold.
For a simple amplitude-based example:
Human headroom = Human signal − Threshold

Pet margin = Threshold − Pet signal
If the human signal is 2.0 V, the pet signal is 1.2 V and the decision threshold is 1.5 V:
Human headroom = 2.0 − 1.5 = +0.5 V

Pet margin = 1.5 − 1.2 = +0.3 V
Both signals are therefore on the intended side of the selected threshold in this simplified example.
The advantage of Method A is that it relates directly to the detector’s selected decision condition.
A human signal below the threshold is immediately visible, as is a pet signal that exceeds it.
The limitation is equally important:
threshold margin is not an optical property of the lens alone.
The result depends on the detector’s threshold, analog gain, digital processing, sensitivity setting, temperature behavior and other system conditions.
For that reason, a threshold-margin specification should always state the detector configuration under which the measurement is made.
How does Method B measure human-to-pet signal separation?
Method B removes the decision threshold from the calculation and compares the two measured signals directly.
One possible expression is:
Signal separation (%) = (Human − Pet) / Human × 100For example:
Human signal = 1.0 V
Pet signal   = 0.3 V

Signal separation = (1.0 − 0.3) / 1.0 × 100
                  = 70%
This method is useful when the objective is to evaluate how strongly the optical and thermal path differentiates the two targets under the same test conditions.
Unlike Method A, it does not require a specific alarm threshold.
That can make it useful during
PIR lens simulation and optical system design
,
where the lens supplier may not control the final detector firmware or alarm threshold.
However, the ratio is only independent of gain under appropriate measurement conditions.
If the signal path is linear, both targets experience the same gain and neither signal is clipped or saturated, a common gain change should leave the ratio approximately unchanged.
Nonlinear processing, saturation, filtering or target-dependent signal processing can change that relationship.
Most importantly, signal separation by itself says nothing about whether the human signal is large enough to be detected.
How do the two engineering metrics compare?
| Characteristic | Method A — Threshold margin | Method B — Human-to-pet separation |
|---|---|---|
| Reference | Detector decision threshold | Human signal amplitude |
| Typical output | Two margins | One ratio |
| Natural unit | V or ADC counts | % |
| Main question | Are the signals on the intended side of the selected threshold? | How strongly are the human and pet signals separated? |
| Depends on threshold | Yes | No |
| Depends on lens design | Yes | Yes |
| Depends on detector configuration | Strongly | Can, especially with nonlinear processing |
| Reveals weak human detection | Yes | Not by itself |
| Useful for optical separation analysis | Indirectly | Yes |
Neither method is inherently wrong.
They answer different engineering questions.
The important point is that a percentage requirement should identify exactly what is being calculated.
Where do the two engineering metrics disagree?
The following measurement illustrates the difference.
Human and pet target signals were measured at fixed distances from 0.5 m to 16 m using one lens configuration.
For this example, a fixed 1.5 V decision threshold is used to illustrate the threshold-margin calculation.
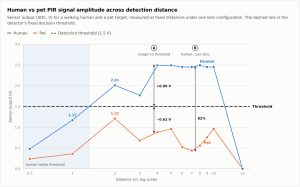
Figure 1. Human and pet PIR signal amplitude versus detection distance. The dashed line represents the 1.5 V decision threshold used for this example. Method A evaluates each signal relative to the threshold, while Method B compares the human and pet signals directly. Source: Fresnel Factory internal measurement, 2026.The same measurement points can then be evaluated using both methods.
| Distance | Human (V) | Pet (V) | Signal separation | Human headroom | Pet margin | Threshold result |
|---|---|---|---|---|---|---|
| 0.5 m | 0.48 | 0.24 | 50% | −1.02 V | +1.26 V | Human below threshold |
| 1 m | 1.17 | 0.36 | 69% | −0.33 V | +1.14 V | Human below threshold |
| 2 m | 2.01 | 1.21 | 40% | +0.51 V | +0.29 V | Both on intended side |
| 3 m | 1.77 | 0.68 | 62% | +0.27 V | +0.82 V | Both on intended side |
| 4 m | 2.49 | 0.88 | 65% | +0.99 V | +0.62 V | Both on intended side |
| 5 m | 2.49 | 0.96 | 61% | +0.99 V | +0.54 V | Both on intended side |
| 6 m | 2.45 | 0.52 | 79% | +0.95 V | +0.98 V | Both on intended side |
| 7 m | 2.45 | 0.44 | 82% | +0.95 V | +1.06 V | Both on intended side |
| 8 m | 2.49 | 0.56 | 78% | +0.99 V | +0.94 V | Both on intended side |
| 9 m | 2.45 | 0.76 | 69% | +0.95 V | +0.74 V | Both on intended side |
| 10 m | 2.45 | 0.96 | 61% | +0.95 V | +0.54 V | Both on intended side |
| 16 m | 0.00 | 0.00 | — | −1.50 V | +1.50 V | Beyond measured detection range |
What can we learn from the 1 m and 2 m measurements?
The 1 m and 2 m points illustrate why the two metrics should not be treated as interchangeable.
What happens at 1 m?
At 1 m, the human signal is 1.17 V and the pet signal is 0.36 V.
The human-to-pet signal separation is therefore approximately:
(1.17 − 0.36) / 1.17 × 100 ≈ 69%A 69% separation might appear attractive if the development objective is purely optical separation.
However, against the illustrative 1.5 V threshold, the human signal has a headroom of:
1.17 − 1.50 = −0.33 VIn this simplified threshold example, the human signal is below the selected threshold.
The ratio alone does not reveal that weakness.
What happens at 2 m?
At 2 m, the human signal is 2.01 V and the pet signal rises to 1.21 V.
The calculated signal separation falls to approximately:
(2.01 − 1.21) / 2.01 × 100 ≈ 40%From a signal-separation perspective, this is the weakest point in the measurement set.
However, relative to the illustrative 1.5 V threshold:
Human headroom = 2.01 − 1.50 = +0.51 V

Pet margin = 1.50 − 1.21 = +0.29 V
Both signals remain on the intended side of the selected threshold.
The important conclusion is therefore not that one metric is correct and the other is wrong.
It is that the two metrics describe different aspects of the system.
At 1 m, optical separation looks relatively strong while the human signal is weak.
At 2 m, absolute detectability looks better while optical separation becomes more difficult.
What does each measurement method fail to show?
Human-to-pet signal separation does not show absolute detectability.
For example:
Human = 2.4 V
Pet   = 0.7 V
Separation ≈ 71%

Human = 0.24 V
Pet   = 0.07 V
Separation ≈ 71%
The ratio is almost identical, even though the absolute signal levels are an order of magnitude apart.
Therefore, a signal-separation target should normally be accompanied by a minimum human-signal or system-detection requirement.
Threshold margin, on the other hand, is threshold-dependent.
A margin measured against 1.5 V can change if the detector’s threshold, gain, temperature compensation or signal-processing algorithm changes.
Method A should therefore be evaluated across the detector configurations and tolerances that matter to the final product rather than being treated as a fixed property of the lens.
| Engineering question | Method A | Method B |
|---|---|---|
| Is the human signal above the selected threshold? | ✓ | — |
| Is the pet signal below the selected threshold? | ✓ | — |
| How strongly are human and pet signals separated? | — | ✓ |
| Can a low absolute human signal be identified? | ✓ | — |
| Can a weak optical separation region be identified? | Indirectly | ✓ |
| Is the result independent of the selected threshold? | — | ✓ |
How should a PIR pet immunity development requirement be written?
The most important step is to define exactly what the development target measures.
A requirement such as “human and pet signal difference ≥70%” is incomplete unless the formula and measurement conditions are stated.
A useful engineering specification should include the following.
- Define the primary metric.
For example:
“Human-to-pet signal separation shall be calculated as (Human − Pet) / Human × 100.” - Specify the measurement distances.
A single percentage measured at one position does not describe the complete detection area. - Define the human and pet targets.
Specify target size, movement direction, speed and other relevant thermal-test conditions. - Define the sensor and signal-processing conditions.
Include sensor part number, gain, filtering, sensitivity mode and any signal-processing assumptions needed to reproduce the measurement. - If threshold margin is used, state the threshold explicitly.
Also specify the tolerance or detector conditions under which that threshold is valid. - If a percentage is used, write the formula.
Expressions such as(Human − Pet) / HumanandPet / Humandescribe related quantities but produce different numbers. - Add a guard condition for the failure mode that the primary metric cannot see.
If signal separation is the main optical target, add a minimum human detectability requirement.
If threshold margin is the main system criterion, also monitor human-to-pet separation to identify difficult optical regions.
This does not require two competing design targets.
One metric can remain the primary optimization objective while the other is used as an acceptance guard condition.
Why can pet immunity vary with detection distance?
In the measurement above, the human-to-pet signal separation varies from approximately 40% to 82% across the 2 m to 10 m range.
This shows that signal separation should not automatically be treated as a constant property of a PIR lens.
The result depends on how the human and pet targets intersect the individual Fresnel detection zones.
Zone geometry changes with distance, viewing angle, mounting height, sensor geometry and the target’s movement path.
In this particular measurement, the 2 m region is especially difficult because the pet signal rises to 1.21 V while the human signal is 2.01 V.
Other lens geometries or mounting configurations may show the most difficult separation at a different distance.
For this reason, a requirement such as:
Human-to-pet signal separation ≥ 70%
at every distance from 1 m to 12 m
can be substantially more demanding than a requirement evaluated only at a few representative points.
Meeting a difficult full-range requirement may require changes to one or more of the following:
- Fresnel zone allocation;
- individual zone area;
- focal length;
- lens aperture or overall lens envelope;
- mounting height or sensor position;
- PIR sensor configuration;
- detector threshold or gain strategy; and
- signal-processing algorithm.
A larger lens may be one solution, but it is not the only solution.
The optical and mechanical trade-offs are best evaluated before the housing design is frozen.
How much of pet immunity can the Fresnel lens control?
A PIR Fresnel lens strongly influences the amount of infrared energy directed onto the sensor from each detection zone.
Changing the zone geometry therefore changes both human and pet signal amplitudes and can change the separation between them.
The lens does not, however, independently determine the final pet-immunity performance of the detector.
The complete result also depends on:
- PIR sensor element geometry;
- sensor orientation;
- analog gain;
- filtering;
- decision threshold;
- firmware and signal-processing algorithm;
- mounting height;
- target trajectory; and
- ambient and target temperature conditions.
For custom PIR lens development, Fresnel Factory can use the customer’s sensor geometry, mounting position and required coverage pattern as inputs for
lens simulation and system design consultancy
.
After prototype fabrication, detection-zone and signal measurements can also be evaluated using
optical performance testing for infrared sensing devices
.
What information should be sent to a PIR lens supplier for a pet immunity project?
For a custom pet-immunity lens project, the following information is particularly useful:
- PIR sensor manufacturer and part number;
- dual-element or quad-element sensor configuration;
- sensor orientation;
- mounting height;
- required horizontal and vertical field of view;
- maximum human detection distance;
- required pet-immune area;
- pet target definition, including intended size or weight class;
- human target assumptions;
- required test distances;
- signal-processing and threshold assumptions; and
- the exact formula used for any human-to-pet signal percentage requirement.
Providing these parameters at the beginning of development reduces the chance that the lens supplier and detector manufacturer optimize against different definitions of success.
Does EN 50131 define a universal pet immunity percentage?
EN 50131-2-2 covers passive infrared detectors used in intrusion and hold-up alarm systems and specifies performance requirements for PIR detectors within the EN 50131 framework.
It should not, however, be interpreted as establishing a universal human-to-pet signal-separation percentage or a universal pet-weight rating that applies to every PIR product.
Pet-immunity targets and the way they are verified can therefore remain product- or manufacturer-specific.
For lens development, the practical implication is straightforward:
do not assume that a statement such as “70% pet immunity” has a universally understood engineering formula.
Write the formula and test conditions into the project specification.
FAQ
What is pet immunity in a PIR motion detector?
Pet immunity is the ability of a PIR detector to detect a person while reducing unwanted alarms caused by animals within the intended pet-immune conditions. Commercial products often describe the capability using a maximum pet weight, while engineering development may additionally use measured signal criteria.
Is there a standard definition of pet immunity percentage?
There is no single universal percentage formula that should automatically be assumed for every PIR lens-development project. If a percentage is required, the formula and test conditions should be written explicitly.
What is human-to-pet PIR signal separation?
It is a comparison of measured PIR signal amplitudes from human and pet targets. One possible formula is (Human − Pet) / Human × 100.
Does a 70% human-to-pet signal separation guarantee pet immunity?
No. A ratio does not show whether the absolute human signal is large enough for detection or whether the pet signal crosses the detector’s actual alarm condition.
Why does pet immunity performance change with distance?
Human and pet targets intersect different portions of the Fresnel detection zones as distance and angle change. Their relative optical coupling to the PIR sensor therefore changes across the coverage area.
Can a Fresnel lens alone determine pet immunity?
No. The lens is an important part of the system, but sensor geometry, mounting height, gain, filtering, detection threshold and firmware also affect the final result.
Does changing PIR sensitivity change the signal ratio?
If the signal path is linear, the same gain is applied to both targets and neither signal saturates, a common gain change should have little effect on the ratio. Nonlinear processing or clipping can change it.
What information is needed to design a pet-immune PIR Fresnel lens?
The lens designer should know the PIR sensor, sensor orientation, mounting height, field of view, detection distance, pet target, human target, test positions and the exact signal or threshold criteria used for acceptance.
Developing a Pet-Immune PIR Detector?
Fresnel Factory develops and manufactures Fresnel optics using multiple manufacturing methods, including injection molding, hot pressing, casting, roll-to-roll and hot embossing.
For PIR applications, lens geometry can be developed around the sensor, mounting height and required detection-zone pattern.
- View PIR Fresnel lenses:
PIR Motion Detector / Infrared Lens
- Optical design and custom lens development:
Lens Simulation and System Design Consultancy
- PIR detection performance testing:
Optical Performance Test for Infrared Sensing Devices
- Stock products through DigiKey:
Fresnel Factory on DigiKey
Related reading:
“How to Calculate PIR Detection Zones from Fresnel Lens Geometry”
·
“Wall-Mount vs Ceiling-Mount PIR Lens: Which to Choose”
·
“How Is PIR Detection Range Actually Measured? Inside IEC 63180”